ltsgraph
This tool draws a labelled transition system (LTS). It can read graphs in .aut, .lts and .fsm format. Graphs can be drawn in 2D and 3D format.
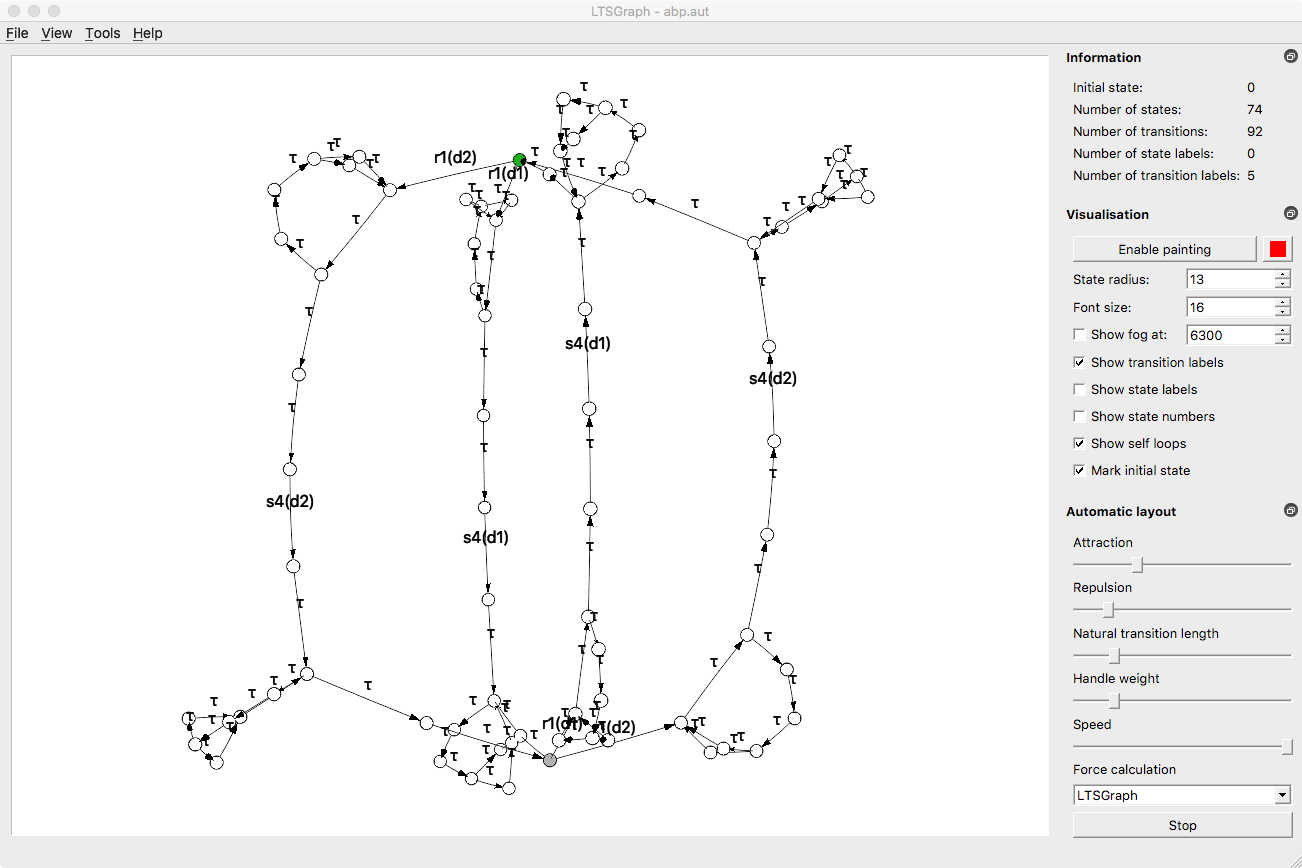
The main window of the tool shows the labelled transition system described by the input file as a directed, labelled graph. The graph can be layed out automatically by using the “Automatic layout” option from the “Tools” menu. Alternatively, individual states can also be moved by dragging them with the mouse. When clicking a state with the right mouse button, its position is fixed.
The viewpoint can be moved by holding down the “Control” button and dragging with the left mouse button. Zooming in or out can be with the scroll wheel or by dragging up/down while pressing the middle mouse button. In 3D mode (activated from the “View” menu), the graph can rotated by dragging with the right mouse button or by holding “Shift” and dragging with the left mouse button.
Exploration mode (activated from the “Tools” menu) allows the user to investigate a specific part of the graph. After exploration mode is turned on, only the initial state and its successors are displayed. When clicking one of the successors, it is expanded. It is also possible to collapse states for which no successor has been expanded.
Note
This normal mode ltsgraph is only usable for small state spaces of up to about 200 states. In exploration mode small parts of large graphs can be explored. For visualising larger state spaces it is also recommended to use ltsview to visualise the structure of large graphs. The tool diagraphica is especially designed to inspect the structure of the data occurring in large graphs.
- orphan:
Usage
LTSGraph [OPTION]... [INFILE]
Description
Tool for visualizing a labelled transition systems as a graph, and optimizing graph layout. When INFILE is -, an LTS is read from standard input.
Command line options
--timings[=FILE]
append timing measurements to FILE. Measurements are written to standard error if no FILE is provided
Standard options
-q , --quiet
do not display warning messages
-v , --verbose
display short log messages
-d , --debug
display detailed log messages
--log-level=LEVEL
display log messages up to and including level; either warn, verbose, debug or trace
-h , --help
display help information
--version
display version information
--help-all
display help information, including hidden and experimental options